Multi-Dimensional Metadata: Overview
Introduction
Multi-dimensional metadata refers to the definitions and logical organization of data used in On-Line Analytical Processing (OLAP) applications. This logical organization is generally specialized for most efficient data representation that enables fast and efficient processing of ad-hoc queries issued by means of specialized Business Intelligence (BI) tools. There are three implementations of OLAP representations: relational, multi-dimensional, and hybrid, which are often referred to as ROLAP, MOLAP, and HOLAP. While the relational approach uses the concepts of table and primary-foreign key to describe the desired OLAP schema, a multi-dimensional approach uses specialized data structures for representing hyper-cubes with multiple axes. The hybrid approach in turn offers a combination of the relational tables and the multi-dimensional hyper-cubes to represent the OLAP data structures.
What is multi-dimensional metadata?
The multi-dimensional model is a key aspect of a data warehouse design. A well-designed dimensional model can in turn offer an efficient organization to a wealth of information that can be effectively analyzed. The dimensional model was originally created for the retail industry. This industry has traditionally analyzed the data pertaining to it business by simple dimensions, such as products and geographies. The relational implementation of this dimensional model generally uses a large central fact table that serves as a hub for many smaller dimension tables. The fact table contains the measurable facts, e.g., total sales and units sold, and the dimensions represent the attributes pertaining to the various business segments of the dimensional model. The central fact table is the only table in the schema with multiple joins connecting it to the dimension tables. Each dimension table in turn has a relational join connecting it to the central fact table. An example of a multi-dimensional model and its relational representation are shown in Figure 1.
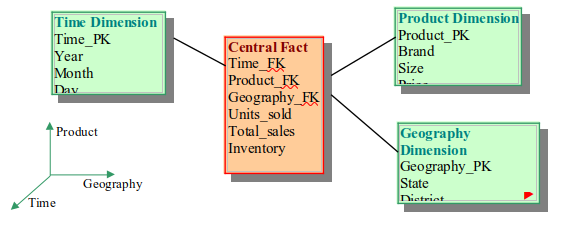
Figure 1. A simple multi-dimensional schema with one fact table and three dimension tables
Different relational representations of multi-dimensional models
There are different types of multi-dimensional models depending on the degree of redundancy desired in the logical schema. By having more redundancy, one can improve the efficiency of data access but will have a less normalized representation of the logical schema. The most common type of a multi-dimensional schema is called a star schema. A star schema is a normalized multi-dimensional model for which each of the disjoint dimensions is represented by a single relational table. The simple model shown in Figure 1 is in fact a star schema.
Another type of a normalized multi-dimensional model is a snow-flake schema. A snow-flake schema is logically similar to a star-schema except that at least one dimension is represented in two or more hierarchically-related tables. For example the model in Figure 1 can become a snow-flake schema if the product dimension is represented by means of multiple tables, perhaps one for the main product attributes, one for the brand attributes, and one for a specific brand attributes.
In the case of non-normalized multi-dimensional models, there exist duplicate attributes (or redundant data) in tables that are associated with a dimension. This redundancy in turn allows one to quickly retrieve various attributes of a dimension without having to perform multiple joins between the tables corresponding to that dimension. For our example in Figure 1, one may choose to have multiple tables associated with the product dimension, however, there may be duplicate data in the brand and the specific brand tables.
Key concepts of multi-dimensional modeling
The following is a glossary of key concepts of multi-dimensional modeling, presented in alphabetical order.
Aggregate: Pre-stored summary of data or grouping of detailed data which satisfies a specific business rule. Example rules may be sum, min, count, or combinations of them.
Attribute: A specific property of a dimension. Examples are size, type, and color.
Cardinality: The maximum number of dimension instances that can participate in a relationship, i.e., one-to-one, one-to-many, and many-to-many.
Cube: A set of related factual measures, aggregates, and dimensions for a specific dimensional analysis problem. An example may be regional product sales.
Dimension: A set of properties that describe a specific aspect of a business and used for analyzing the factual measures of one or more cubes which use that dimension. Examples include geography, time, customer, and product.
Drilling: Drilling is the term used for navigating through a cube. This navigation is usually performed to access a summary level of information or to provide more detailed properties of a dimension in a hierarchy.
Fact: A fact is a time variant measurement of quantitative data in a cube; for example, units sold, sales dollars, or total profit.
Hierarchy: The concept refers to the level of granularity represented by the data in a particular dimension of a cube. For example, state, county, district, and city represent different granularities of the geography dimension.
Measure: The means for representing quantitative data in facts or aggregates. Example measures are total sales or units sold per year.
Normalization: A process used for reducing redundancies and removing anomolies in related dimension tables in various hierarchies.
Redundancy: A term used for referring to duplication of data among related tables for the sake of improving the speed of query processing.
Star Schema: A normalized multi-dimensional model in which each disjoint dimension is represented by a single table.
Snow-Flake Schema: A normalized multi-dimensional model in which at least one dimension is represented by two or more hierarchically related tables.